06 · Digital Product · 2025
Immune Forecast
A health-tracking concept designed to help people understand patterns, flare risk, and changes over time without overwhelming them with raw data.
Role
Concept · Product Design · Interaction Design · Development
Tools
React Native · Expo · Local Storage
Format
Independent Mobile Product
01 · Problem
Health data is easy to collect and hard to interpret
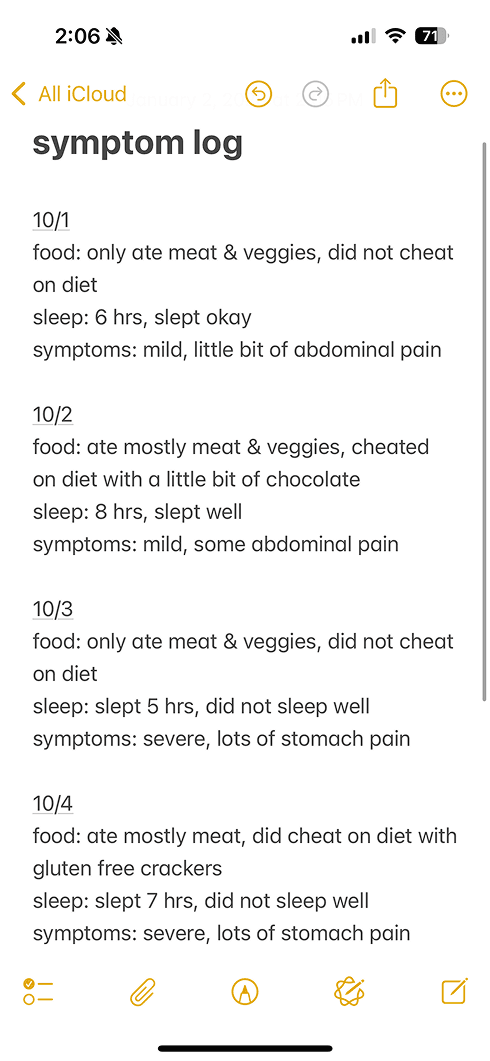
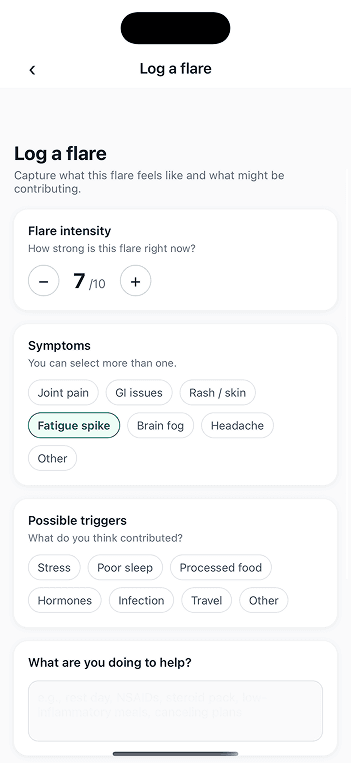
Symptom tracking often produces long lists of isolated entries. Immune Forecast began with a simpler question: how could daily observations become a clearer picture of change, pressure, and patterns over time?
02 · System
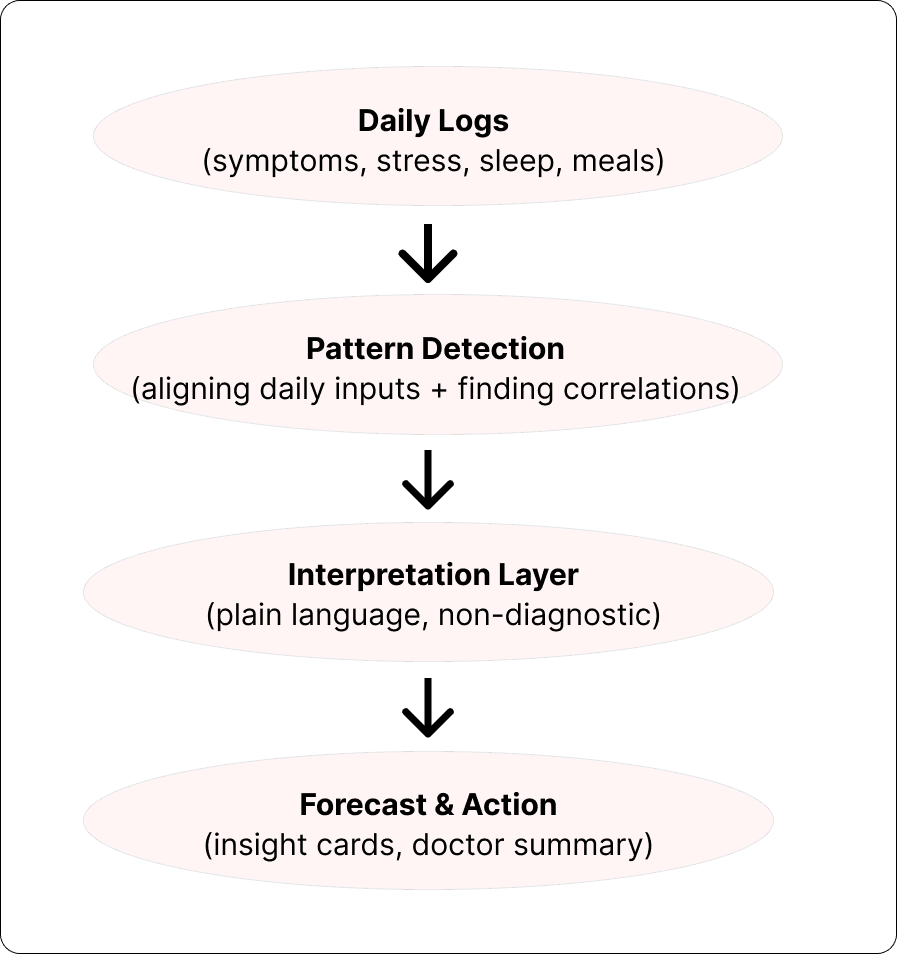
Turning daily inputs into something interpretable
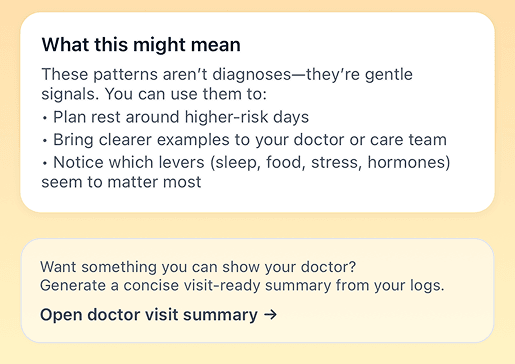
The system moves from daily logging to pattern detection, then translates those patterns into plain-language interpretation and useful next steps. The goal is not diagnosis, but helping users see relationships that are difficult to recognize across scattered notes.
03 · Core Experience
Three views for tracking, reflection, and anticipation
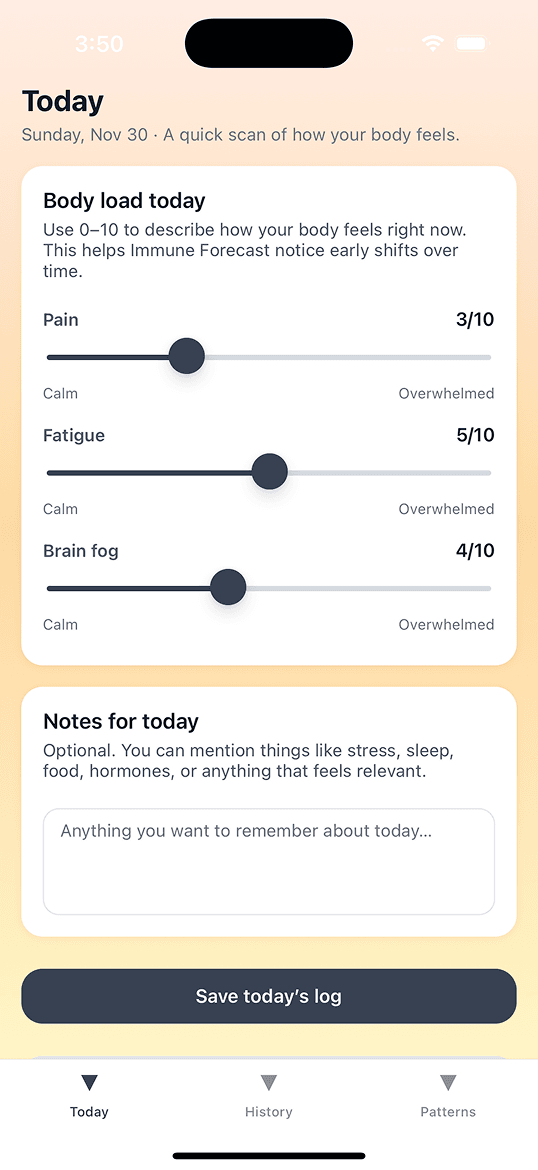
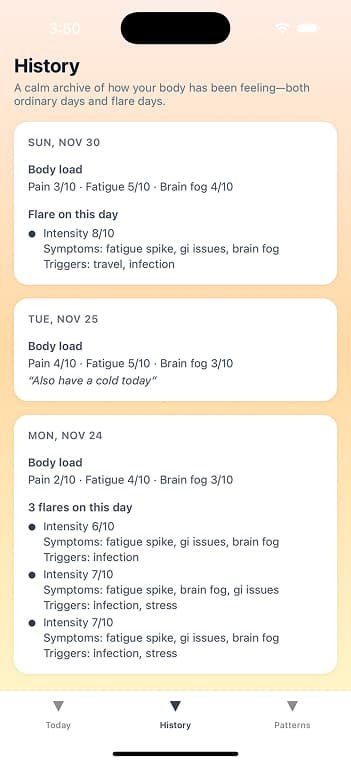
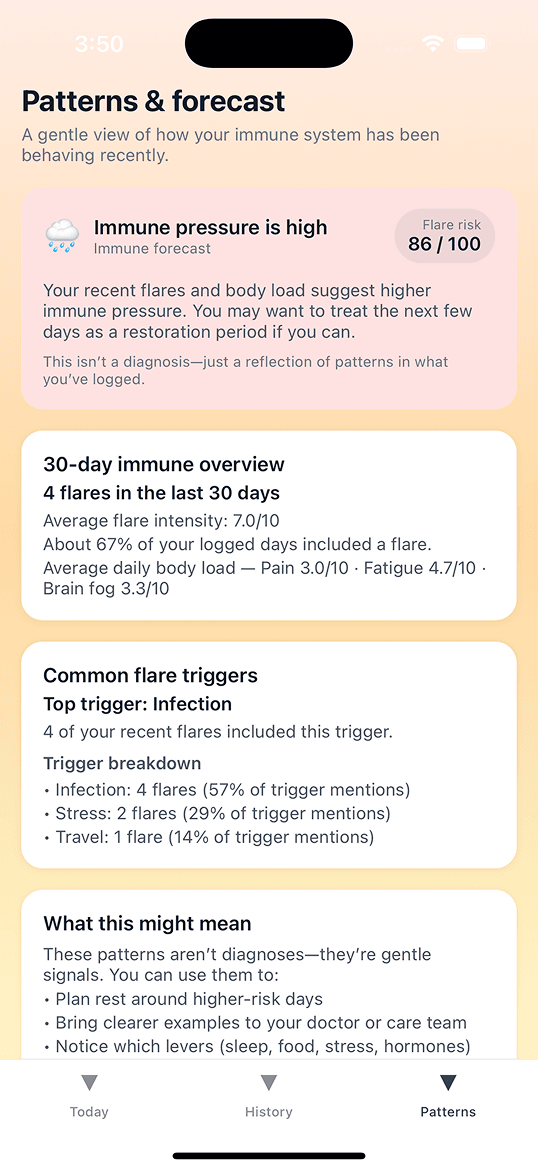
Today keeps logging lightweight, History makes past entries legible, and Patterns turns recurring signals into a forward-looking view. Together, the three screens move from capture to understanding without requiring users to interpret dense health data themselves.
04 · Flare Tracking
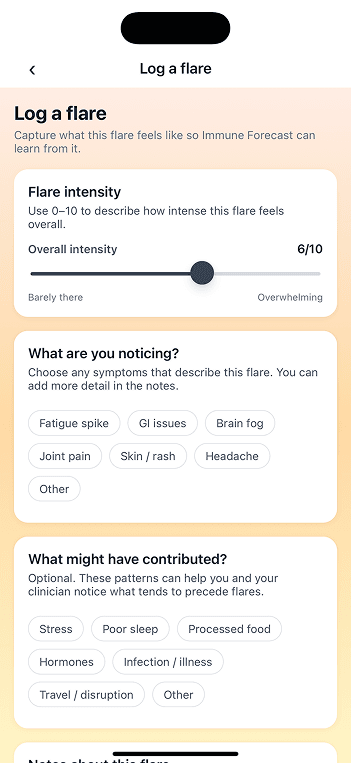
Separating flare events from everyday body load
Flare logging captures intensity, symptoms, possible triggers, and what the user is doing to help. Keeping flare events distinct from baseline daily logs makes it easier to compare acute episodes with the conditions surrounding them.
05 · Interpretation
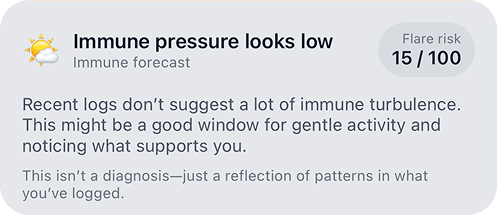
Communicating risk without pretending to diagnose
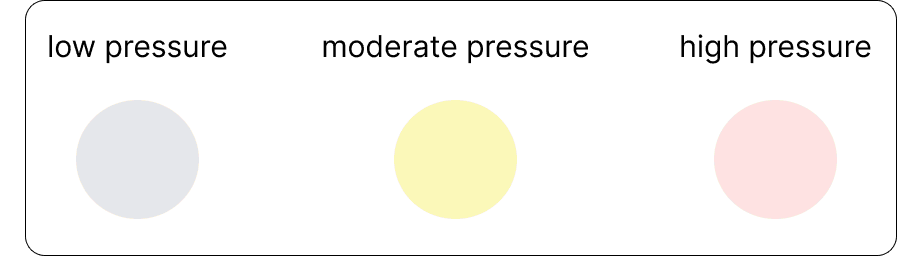
Forecast states use simple language, a visible flare-risk score, and a restrained color system to communicate relative immune pressure. The language stays explicitly non-diagnostic while still helping users understand when their recent patterns may warrant more care or rest.
06 · Doctor Summary
Making tracking useful in a clinical conversation
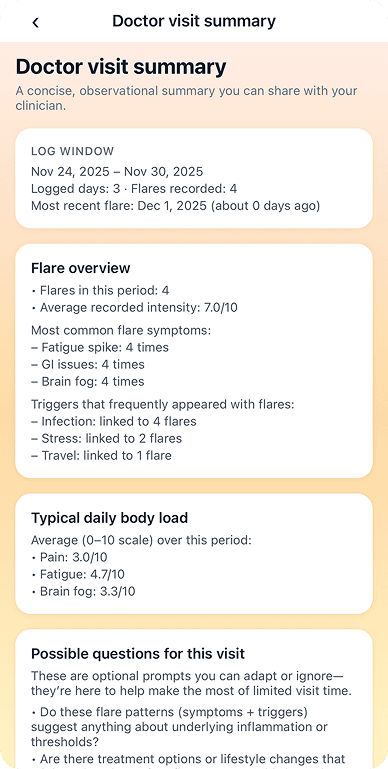
The Doctor Summary condenses recent logs, flare frequency, common symptoms, recurring triggers, and typical daily body load into a format that can support an appointment without requiring the user to reconstruct weeks of symptoms from memory.
07 · Build
Keeping the prototype private and lightweight
I built the prototype in React Native with Expo and used local storage rather than a cloud backend. This kept the system simple while supporting the core interaction model and maintaining a privacy-conscious product direction.
08 · Final
A calmer way to understand health patterns over time.
Reflection
Immune Forecast pushed me to think carefully about how complex and sensitive information can be translated into something readable, calm, and useful. It reinforced my interest in designing systems that help people make sense of information rather than simply collect more of it.